From Pixel Pushing to Value Creating
Client
Moneytree
Year
2024
Role
Discovery & Design Lead

Approaching Discovery in a Whole New Way
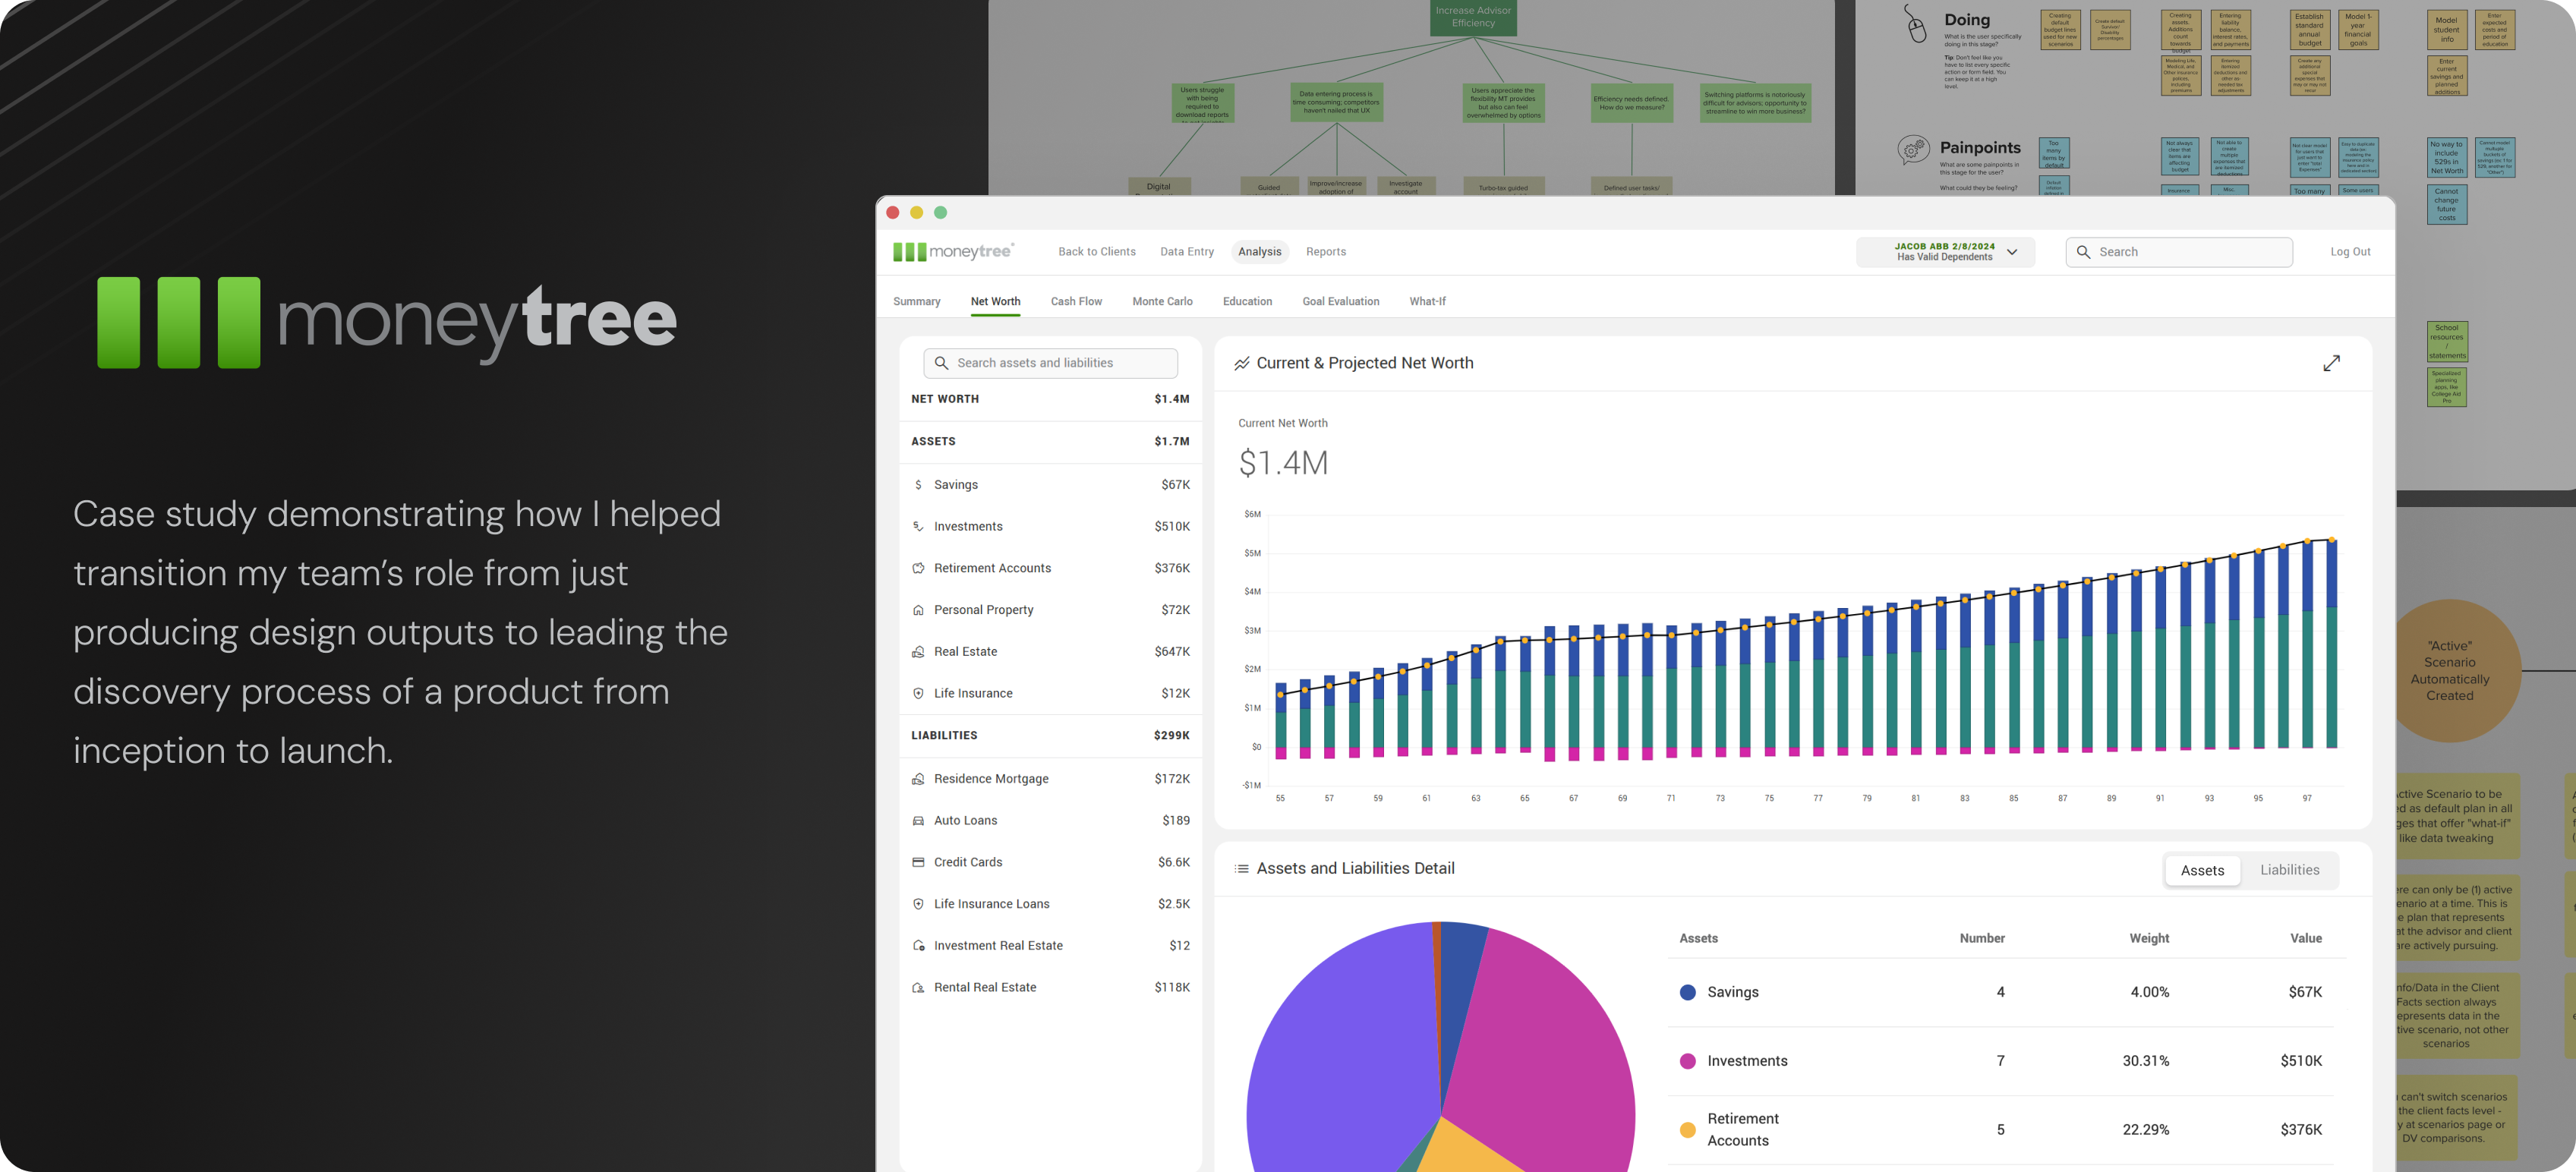
The aspect of this project I am most proud of is how I led our Product Design team to collaborate with the Moneytree product team in a completely new way compared to how our organization (Accutech) traditionally approached discovery and design.
Instead of the typical “mercenary” approach many design teams are boxed into – i.e. being told exactly what to design and not really being involved in the discovery process – our team took a new approach of being “missionaries” – i.e. being involved from the start of the project and leading the process to thoroughly understand desired outcomes from the perspective of the user and business.
Acting on the Key Insight
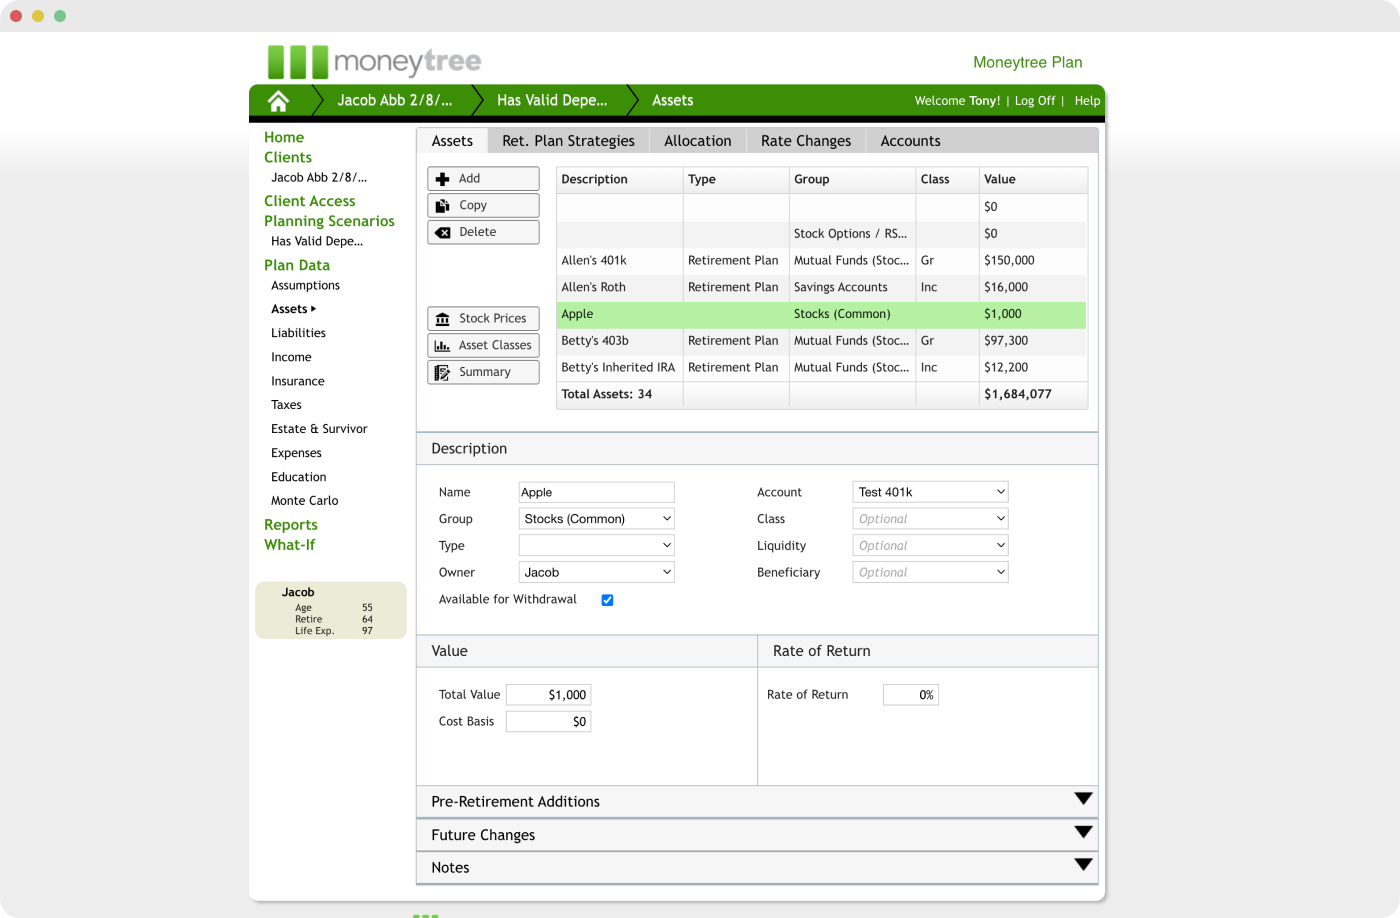
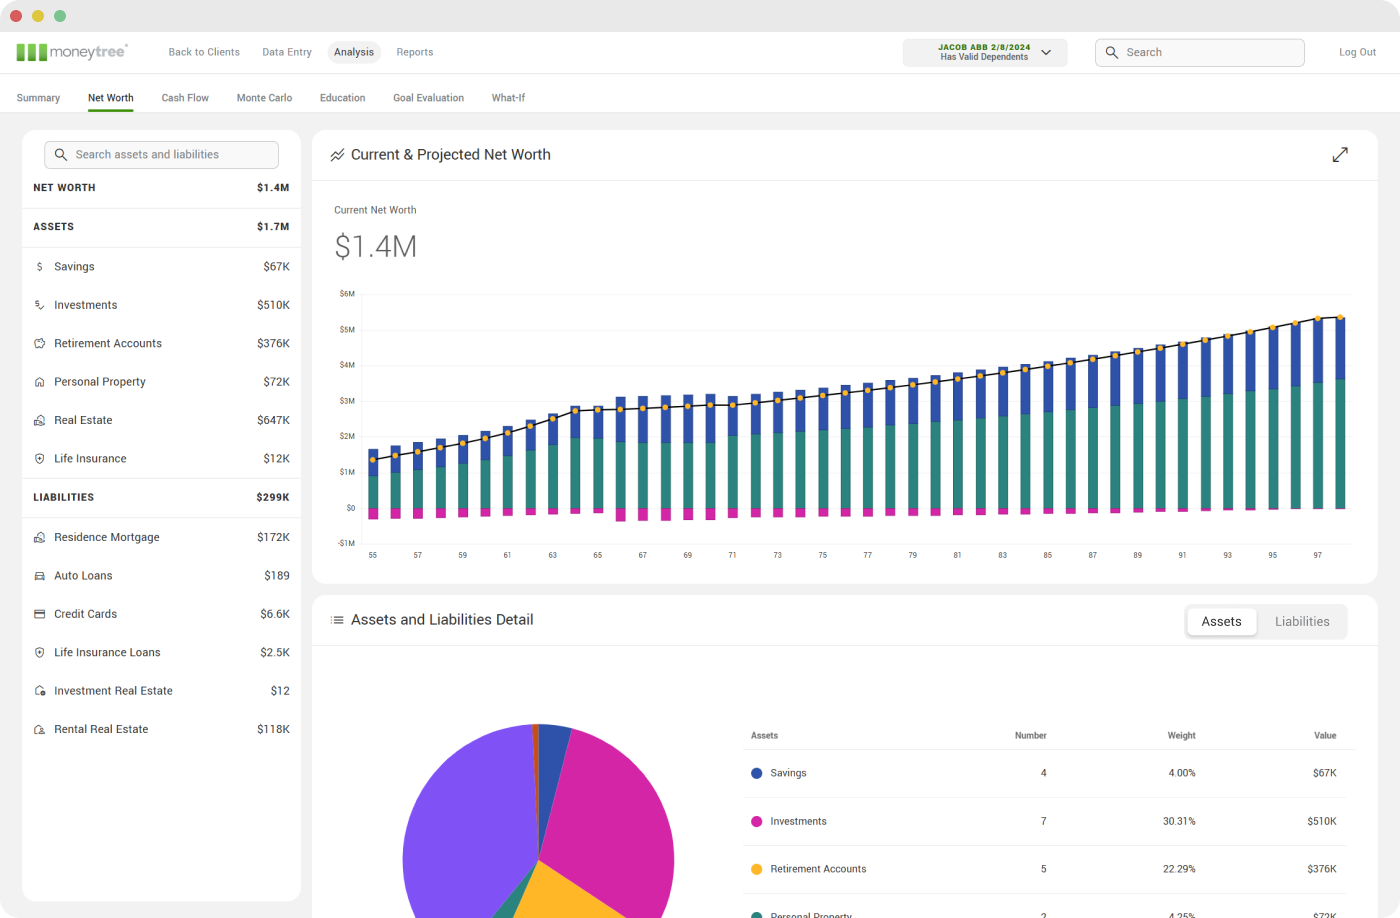
The overwhelming insight we uncovered from our UX research is that users wanted so much more than a glorified data entry platform. They wanted to show their clients, in real time, how their financial outlook changes based off of different scenarios – WITHOUT – having to download PDF reports over and over. And so our whole approach to this project was building a digital presentation UX on top of Moneytree’s data entry foundation. After throwing in a modern style refresh, the before and after results of the project were astounding.
Before & After
See the transformation below from an outdated data entry tool to an interactive data visualization financial planning platform.
Other Screens
See actual screenshots of the developed application below, not just Figma mockups. The design system, another product I manage, was crucial in connecting design with development.
Low-Fi Concepts
Sketches and low-fi concepts showing the journey we took from inception to final design.
Discovery Tools
- Behavior Blueprint
- Digital Presentation Inventory
- Navigation Card Sorting
- Workflow Diagramming
- Opportunity Solution Tree
About
Exercise to define, if a project is successful, what user behaviors we will see more of, less of, and what new behaviors we will see.
Key Result
A mutual team understanding of what success looks like and how users will behave differently if we are successful.

About
Simple card sorting exercise to delve further into the signal that users primarily wanted digital presentation to be prioritized and why. Common cards were combined for summary purposes.
Key Result
A thorough understanding of why users wanted digital presentation of data, where in the app made the most sense to include, and how to improve on competitor offerings, etc.

About
Exercise to outline complex workflows and the actions, pain points, and touchpoints associated with those workflows. This was completed from team knowledge and user interviews for multiple workflows.
Key Result
A shared team understanding of the workflows most important to users and the opportunities that exist to improve said workflows.

About
Exercise to diagram all possible brainstormed solutions to potential opportunities. All too often feature ideas are proposed as binary do or don’t do decisions and comparing all solutions to each other at once helps with prioritization.
Key Result
A mutual team understanding of the solutions our team feels best addressed opportunities and which ones we are prioritizing and why.

User Testimonials
“This is one of the best financial planning tools I have ever seen and I have been doing this since 1999.”
Greg Gilbert
CEO, Infinity Financial Services
“The way you set it up is intuitive. I think you have a win here and are going to have a lot of happy advisors.”
Bill Hampton
CEO, Hampton Tax & Financial Services


